
Most beginners drown in YouTube analytics because they track everything and understand nothing. You open YouTube Studio and see 47 different metrics. Views, subscribers, watch time, CTR, impressions, end screen clicks, cards, likes, comments, unique viewers, returning viewers… it collapses into noise before you’ve uploaded five videos.
Here’s the truth: youtube analytics beginners only need to master four numbers before touching anything else. Click-through rate tells you if your packaging works. Average view duration tells you if your content holds attention. Impressions tell you whether YouTube is testing your video. Unique viewers tells you if you’re growing your audience or just rewatching your own content.
I spent 11 months optimizing the wrong metric—views—before I realized my channel was shrinking even while my view count grew. I had 15,000 views but 72% were from the same 200 people. That’s not growth. That’s an echo chamber. This post shows you which numbers actually matter, where to find them, and what to do when they move in the wrong direction.
You’ll walk away with a clear checklist for analyzing every video, a timeline for when to act on data, and a framework for deciding whether to improve your thumbnail, your script, or your topic entirely.
YouTube & Video Creation hub — Start here for the complete creator system.
What YouTube Analytics Rewards (and Punishes If You Ignore It)
YouTube’s algorithm optimizes for one thing: viewer satisfaction. Everything else is a proxy for that goal. When viewers watch more, return more, and search more, YouTube pushes your content. When they bounce, skip, or never click, YouTube stops showing it.
This matters because most beginners treat analytics as a scoreboard instead of a diagnostic tool. You don’t watch analytics to feel good. You watch it to find the exact point where your video fails and fix it.
On my third video, I got 847 views with a 2.3% CTR and 38% average view duration. I thought the views meant I was doing something right. YouTube Studio’s Audience tab later revealed that 61% of viewers dropped off in the first 30 seconds. My hook was weak.
I rewrote the first 15 seconds for video four, CTR jumped to 6.8%, and average view duration hit 54%. The views doubled. The topic didn’t change. The packaging and opening did.
YouTube punishes three behaviors most severely:
The system rewards clarity. If your thumbnail promises one thing and your video delivers another, viewers leave. YouTube notices. Next time, it shows your video to fewer people.
The Four Metrics That Actually Move the Needle
Not all metrics carry equal weight. Some are vanity. Some are diagnostics. Some are lead indicators. Here’s what matters for youtube analytics beginners 2026:
YouTube scripting framework — Learn the exact structure that fixes retention.
Click-Through Rate (CTR)
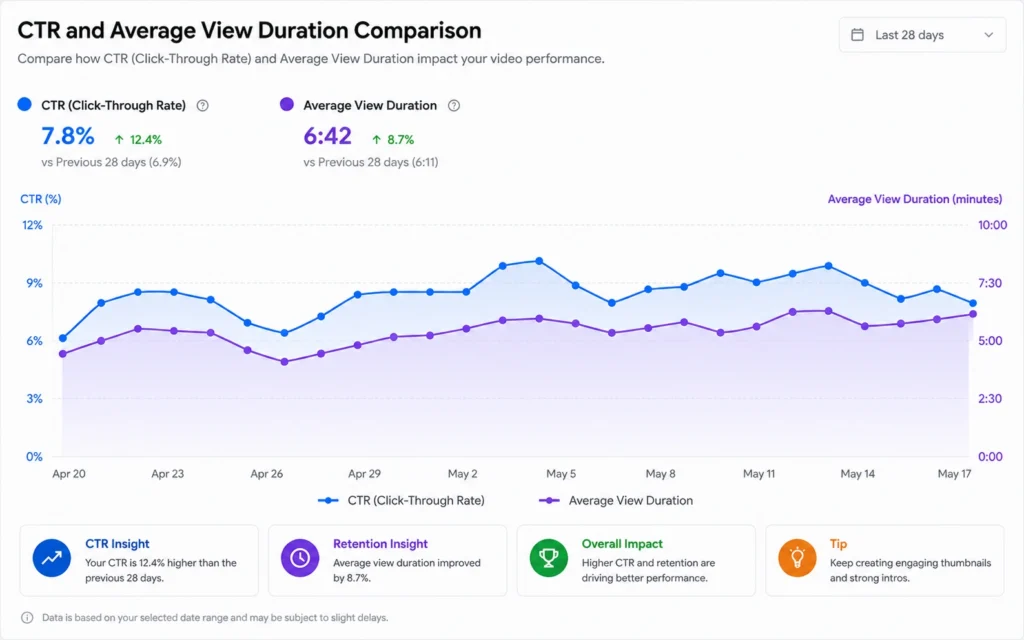
What it is: The percentage of people who see your thumbnail and title (impressions) and actually click.
What good looks like: 4–10% is solid for most channels. Entertainment content can hit 8–15%. Tutorials often run 3–6%.
What it tells you: Your packaging either works or it doesn’t. CTR under 4% means your thumbnail or title needs redesign. CTR over 10% means your packaging is strong—but you still need to check retention.
When to act: Wait 48 hours before changing CTR. YouTube needs time to test your video across audience segments. If CTR stays under 4% after 7 days, update your thumbnail and title together, not separately.
Average View Duration (AVD)
What it is: The average percentage or time viewers watch of your video.
What good looks like: 45–65% for videos under 10 minutes. 35–50% for videos 10–20 minutes. Above 65% is exceptional.
What it tells you: Whether your content holds attention. Low AVD means your script, pacing, or topic needs work. High AVD with low CTR means your packaging is weak but your content is strong—fix the thumbnail first.
When to act: Check the retention graph. If there’s a sharp drop at a specific timestamp, cut that section in future videos. If the drop is gradual, your opening is too slow.
Short-form hook strategies — Adapt these hooks for long-form openings.
Impressions
What it is: How many times YouTube shows your thumbnail to viewers.
What good looks like: Impressions vary wildly by niche and channel size. What matters is the trend. Are impressions growing week over week?
What it tells you: Whether YouTube is testing your video. Low impressions mean YouTube hasn’t found your audience yet—or it tried and viewers didn’t click. High impressions with low CTR means your packaging is the problem. High impressions with high CTR means YouTube will keep pushing your video.
When to act: Don’t act on impressions alone. Pair them with CTR. If impressions are high and CTR is low, fix packaging. If impressions are low and CTR is high, keep uploading—YouTube hasn’t finished testing.
Unique Viewers
What it is: The number of individual people who watched your video, not counting repeat views from the same person.
What good looks like: You want unique viewers to grow over time. If views are high but unique viewers are flat, you’re getting repeat views from the same audience.
What it tells you: Whether you’re expanding your reach or just engaging your existing fans. This is the metric that exposes fake growth.
When to act: Check the Audience tab in YouTube Studio. Look at “Videos that brought new viewers” over the past 90 days. If this number is low, your topics aren’t reaching new audiences. Broaden your topic selection or improve discoverability through search.
Step-by-Step Guide: How to Read YouTube Analytics Without Overthinking
You don’t need advanced mode or third-party tools to start. Open YouTube Studio and follow this sequence.
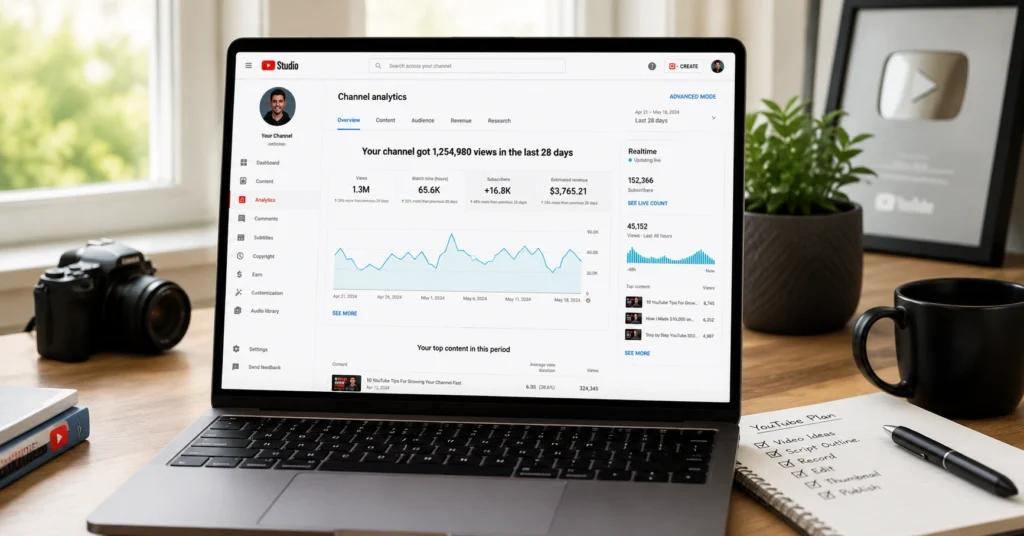
Step 1: Access the Right Dashboard
Open YouTube Studio. Tap Analytics in the bottom menu for channel-level data. For individual video analytics, go to Content, select your video, and tap VIEW MORE in the Analytics section.
Start with the Overview tab. It shows views, watch time, subscribers, and top-performing videos at a glance.
Step 2: Check Reach First
The Reach tab shows impressions, CTR, and how viewers found your video. This is your diagnostic starting point.
Ask three questions:
- Are impressions growing?
- Is CTR above 4%?
- Are viewers finding you through Search, Suggested, or Browse?
If CTR is low but impressions are high, your packaging is the bottleneck. If impressions are low but CTR is high, keep uploading—YouTube is still testing.
Step 3: Check Engagement Next
The Engagement tab shows average view duration, likes, comments, and shares. Focus on the retention graph.
Look for:
- Sharp drops at specific timestamps (cut that section next time)
- Gradual decline (your opening is too slow)
- Spikes (viewers rewound—this is good content, do more of it)
YouTube now rewards structured scripts with clear segments. Predictable narratives maintain attention better than meandering content.
Step 4: Check the Audience Tab
The Audience tab shows returning vs. new viewers, peak watch times, and videos that brought the most new viewers.
This is where you confirm whether you’re growing. If returning viewers dominate but new viewers are flat, your content isn’t reaching new people.
Step 5: Set a Review Cadence
Check analytics on this schedule:
| Time After Upload | What to Check | Action Threshold |
|---|---|---|
| 24 hours | CTR, initial impressions | No action yet |
| 48 hours | CTR, retention graph | Consider thumbnail/title test if CTR <4% |
| 7 days | All four metrics | Update packaging if CTR still low |
| 14 days | Final performance | Archive learnings, apply to next video |
Don’t make changes before 48 hours. YouTube needs time to test your video across segments.
Tips & Examples: What High-Performing Videos Do Differently
You can’t improve what you don’t understand. Here’s what the data shows about videos that outperform.
The First 30 Seconds Decide Everything
YouTube’s retention modeling increasingly rewards videos that deliver value immediately. Avoid long intros. Start with the promise, the problem, or the payoff in the first 10–20 seconds.
What I tested: Video six had a 20-second intro with channel branding. Average view duration: 34%. Video seven removed the intro entirely and opened with the core question. Average view duration: 58%. Same topic. Same script afterward. The opening changed everything.
Structure Your Content Into Clear Segments
A predictable, well-organized narrative helps maintain audience attention. Use Chapter markers. Name your sections. Signal transitions clearly.
Example: A 12-minute tutorial on “How to Edit YouTube Thumbnails” works better when structured as:
- 0:00–0:20 — Hook (show the before/after)
- 0:20–2:00 — Tool setup
- 2:00–6:00 — Step-by-step process
- 6:00–8:00 — Common mistakes
- 8:00–10:00 — Final review
- 10:00–12:00 — CTA and next video tease
Viewers can follow the structure. YouTube rewards the retention.
Boost Natural Interaction Without Begging
Questions, polls, and calls for participation help YouTube identify relevance. But generic “like and subscribe” pleas don’t work.
What works: “If this shortcut saved you time, tell me which one in the comments—I’m building a list for the next video.” Specific, useful, gives viewers a reason to engage beyond obligation.
Apply Dynamic Visual Patterns
Scene changes, graphic inserts, and a compelling narrative rhythm contribute to higher retention. This is especially important with YouTube’s new segmented retention metric.
Practical rule: Change the visual every 15–30 seconds. B-roll, screen share, text overlay, zoom. Static talking heads lose attention faster.
What Most Beginners Get Wrong (and How to Avoid It)
mistakes compound. Fix these early.
Mistake 1: Chasing Views Instead of Watch Time
Views are vanity. Watch time is the signal YouTube uses to rank videos. A video with 1,000 views and 60% retention beats 10,000 views with 20% retention.
The fix: Optimize for average view duration first. Views follow when retention improves.
Mistake 2: Changing Everything After One Video
One underperforming video doesn’t mean your strategy is broken. Collect 5–10 videos before drawing conclusions about what works.
The fix: Track patterns, not outliers. Look for CTR trends across 10 videos, not CTR on one.
Mistake 3: Comparing Your CTR to Other Channels
CTR varies by niche. A 4% CTR might be excellent for a technical tutorial but poor for entertainment content. Compare your CTR to your own past videos, not to others.
The fix: Set your own baseline. After 10 videos, calculate your channel’s average CTR. Use that as your benchmark.
Mistake 4: Ignoring the Audience Tab
The Audience tab shows which videos brought new viewers. If you’re not growing, this is where you’ll find the answer.
The fix: Check “Videos that brought new viewers” monthly. Double down on topics from high-performing videos in this report.
I wasted three weeks optimizing thumbnails for a video series that had a fundamental topic problem. CTR improved from 3.1% to 5.4%, but impressions stayed flat. The Audience tab later revealed that 83% of viewers came from my existing subscribers. The topic wasn’t discoverable. I shifted to search-backed topics, and impressions grew 340% in 30 days. Thumbnails matter. Topics matter more.
Tools to Use (and Tools to Skip)
You don’t need expensive tools to start. Here’s what actually helps.
Built-In Tools (Free)
Third-Party Tools (Optional)
I tried three thumbnail A/B testing tools before realizing YouTube’s own analytics already told me which thumbnail worked. If CTR is under 4%, redesign the thumbnail. If CTR is 6%+, the thumbnail is fine—fix the script instead. Tools don’t replace judgment. Use them to save time, not to make decisions for you.
Skip tools that promise “guaranteed growth,” “algorithm hacks,” or “viral templates.” Those don’t exist. YouTube’s algorithm rewards consistent viewer satisfaction, not shortcuts.
When to Ignore Analytics (and Trust Your Judgment Instead)
Analytics tells you what happened. It doesn’t tell you what to create next.
Ignore analytics when:
- You’re testing a new format for the first 3–5 videos (data isn’t stable yet)
- Your topic is too niche for broad metrics to matter (specialized content has smaller audiences by design)
- You’re creating content for a specific audience segment that doesn’t align with your overall channel stats
Trust judgment when:
- You know your audience better than the data shows (e.g., specialized B2B content)
- You’re experimenting with a format that takes time to mature (documentaries, series)
- The data contradicts what you know works for your specific niche
Analytics is a compass, not a map. It shows direction. You choose the destination.
FAQ: Frequently Asked Questions About YouTube Analytics Beginners
What are the most important YouTube analytics for beginners?
The four most important metrics for youtube analytics beginners are click-through rate (CTR), average view duration, impressions, and unique viewers. CTR tells you if your packaging works. Average view duration shows if your content retains attention. Impressions reveal how often YouTube shows your video. Unique viewers distinguishes new audience from repeat viewers.
How long does it take to see meaningful YouTube analytics data?
You’ll see initial data within 24 hours of uploading, but meaningful patterns emerge after 7–14 days. YouTube needs time to test your video across different audience segments. Wait at least 48 hours before making packaging changes. For new channels, collect 5–10 videos before drawing conclusions about what works.
Should I focus on views or watch time for growth?
Watch time matters more than views for long-term growth. YouTube’s algorithm prioritizes viewer satisfaction, which correlates with total watch time. A video with 1,000 views and 60% retention beats 10,000 views with 20% retention. Focus on average view duration and total channel watch time, not vanity view counts.
What is a good click-through rate for YouTube videos in 2026?
A good CTR for youtube analytics beginners ranges from 4–10%. Videos under 4% need better thumbnails or titles. Videos over 10% have strong packaging but may still need retention work. CTR varies by niche—tutorials often run 3–6%, while entertainment content can hit 8–15%. Compare your CTR to your own past videos, not to others.
Where do I find YouTube Analytics in YouTube Studio?
Open YouTube Studio, then tap Analytics in the bottom menu for channel-level data. For individual video analytics, go to Content, select your video, and tap VIEW MORE in the Analytics section. The Overview tab gives a high-level summary. Reach, Engagement, Audience, and Revenue tabs provide deeper insights.