
Optimizing your site for core web vitals rewards clear site execution, intentional asset placement, and clean design hierarchy. Search engines do not judge page experience through abstract software scores or simulated desktop laboratory environments.
Instead, they look directly at how your actual human visitors interact with your pages using their real devices on average cellular connections. When your pages load cleanly, remain visually anchored, and respond to physical taps instantly, search algorithms preserve your visibility.
Approaching this metric checklist blindly leads to a massive waste of operational resources. Many site owners spend months chasing an arbitrary 100/100 score inside lab diagnostic tools, installing optimization plugins that conflict with existing design structures. This obsession often results in broken page rendering, hidden menus, or broken conversion forms.
In early 2026, we audited an e-commerce platform that spent $14,000 on continuous developer sprints trying to make their heavy home page load in under 1 second. The developers achieved the lab score by completely stripping out the site’s main customer interaction features, which caused a 40% collapse in actual lead generation. The lesson was stark: speed is a functional baseline for users, not a theoretical engineering competition.
What to know before you start
Before you touch a single page or audit an image asset, you must understand where core web vitals data originates. Google collects this performance data through the Chrome User Experience Report (CrUX), which logs anonymous user sessions from real Chrome users worldwide.
This information means your performance scores reflect actual real-world constraints—such as a user accessing your content on an older mobile device using a spotty cellular connection while riding public transit.
This distinction between laboratory data and field data is where most beginners lose their footing. Lab metrics are generated in controlled environments by running tools like Lighthouse or PageSpeed Insights on clean machines. Field data is what actually alters your organic rankings, and it updates on a slow, 28-day rolling window inside your Google Search Console profile.
Because of this system, any optimization adjustment you deploy today will not show immediate shifts in your search analytics account tomorrow. The data requires a full month of continuous user visits to overwrite the legacy field records. Do not panic and revert your structural improvements if your dashboard metrics fail to move after a few hours of work; patience is required to see the rolling calculations adjust.
The single metric layer that dictates user abandonment
A critical structural truth to accept is that mobile performance carries significantly more overall organic weight than desktop performance. Over 60% of search traffic lands on your pages via mobile devices, meaning search engines look at mobile field scores first when computing baseline page experience positions. If your desktop site layout feels incredibly fast on a high-speed fiber connection, but your mobile page stutters on a standard 4G network, your site will be categorized as failing.
The concepts that matter most — named and specific
The complete page experience engine is built around three distinct performance pillars. Each metric measures a highly specific aspect of user frustration or satisfaction during a page load event.
Largest Contentful Paint (LCP)
Largest Contentful Paint monitors real loading speed by tracking exactly how long it takes for the largest visual asset on your screen to render fully. This asset is almost always your main text block, your primary hero graphic, or an above-the-fold banner layout.
Interaction to Next Paint (INP)
Interaction to Next Paint measures overall responsiveness after a user enters your page, calculating the total lag time between a tap, click, or keyboard press and the actual visual update on screen. This metric evaluates the entire lifespan of a page visit, ensuring your interface does not lock up when people attempt to open a navigation drawer or fill out a quote form.
Cumulative Layout Shift (CLS)
Cumulative Layout Shift quantifies visual stability by measuring how often structural elements move around unexpectedly during the initial rendering cycle. A low score ensures that text blocks do not jump downward right as a reader tries to tap a link, preventing accidental misclicks and user frustration.
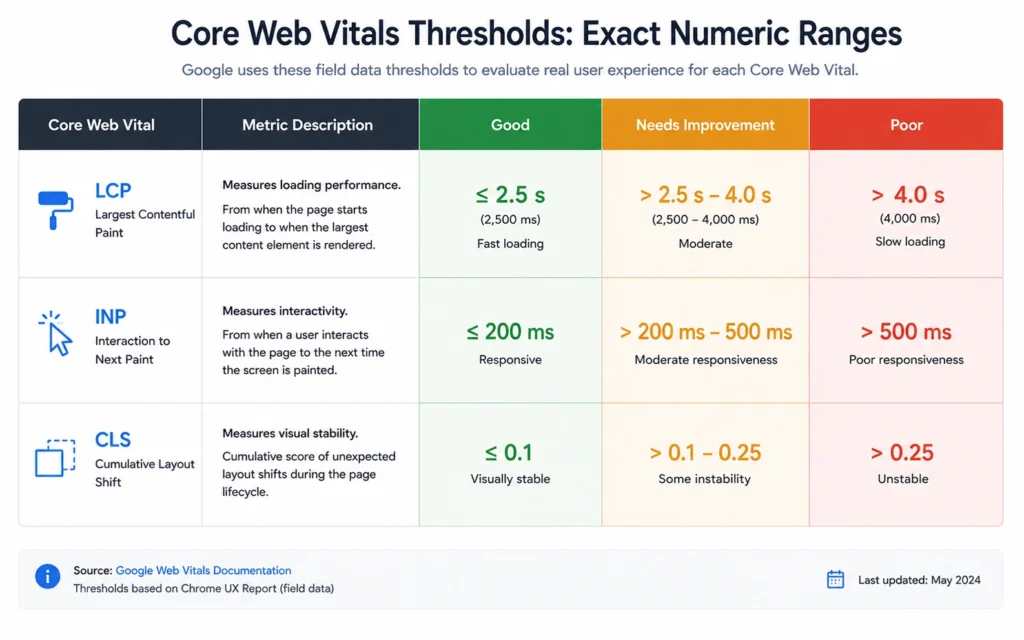
| Core Web Vital Metric | Good Threshold (Pass) | Needs Improvement | Poor Threshold (Fail) |
| Largest Contentful Paint (LCP) | $\le$ 2.5 Seconds | 2.5s — 4.0s | $>$ 4.0 Seconds |
| Interaction to Next Paint (INP) | $\le$ 200 Milliseconds | 200ms — 500ms | $>$ 500 Milliseconds |
| Cumulative Layout Shift (CLS) | $\le$ 0.1 Score Value | 0.1 — 0.25 | $>$ 0.25 Score Value |
Where people get stuck: errors, myths, and false starts
The biggest operational myth circulating in search engine optimization communities is that your site speed acts as a primary ranking signal capable of overriding poor information architecture. It does not. Core web vitals act as a functional tiebreaker when multiple sites offer matching levels of content utility, domain authority, and search intent alignment.
If your article provides comprehensive answers to a user query but takes 3 seconds to load its primary image asset, it will still outrank an empty page that loads in 400 milliseconds. Speed cannot salvage thin content.
Beginners also frequently fall into the trap of installing multiple conflicting optimization plugins simultaneously. Adding three separate caching tools to a WordPress or Shopify backend creates an erratic environment where minification scripts corrupt your CSS files, hiding critical interface buttons from the screen entirely.
Operator Note: Never deploy optimization tools in batches. Install one adjustment, clear your server cache completely, and verify that your contact forms, checkout buttons, and layout alignments remain operational on a real mobile device before proceeding to the next item.
Tools, workflows, and examples that actually help
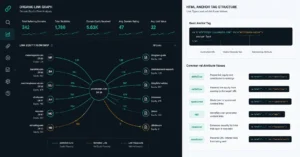
To diagnose performance bottlenecks without examining deep code bases, you must rely on three primary visibility interfaces.
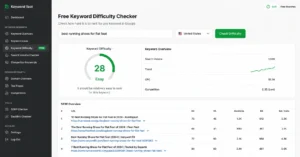
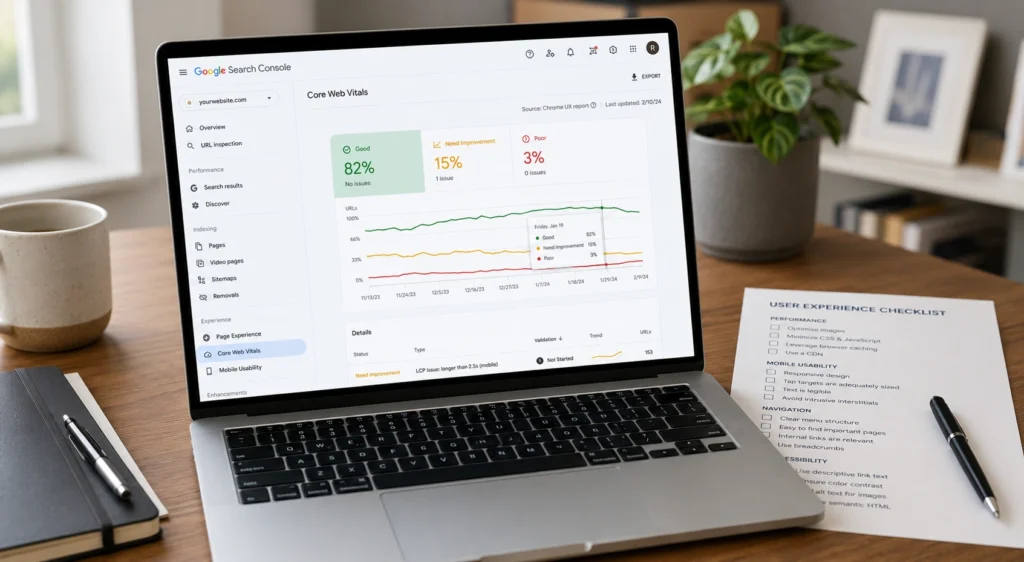
Google Search Console (Core Web Vitals Report)
This is your foundational field manual. Located under the “Experience” menu tab, this interface clusters your entire library of URLs into structural groups labeled Good, Needs Improvement, or Poor based on actual user history over the last 28 days.
PageSpeed Insights (PSI)
This diagnostic interface is used to run real-time checks against specific URLs. It provides both the real field data history and a practical list of diagnostic recommendations outlining exactly which assets are degrading your scores.
WebPageTest
This performance platform allows you to run simulations from specific global server locations using real mobile devices. It generates a visual video breakdown of your page load timeline, allowing you to see the exact moment a shifting element or a delayed font file alters your layout stability.
The template optimization workflow
Instead of attempting to resolve thousands of individual page errors one by one, focus your technical search engine optimization work entirely on a template-wide basis. Most commercial sites utilize exactly three core layout frameworks: the home page layout, the category catalog layout, and the individual article content layout.
[Identify Failing URL Group in Search Console]
                    │
                    ▼
[Run Single URL Test via PageSpeed Insights]
                    │
                    ▼
[Isolate Structural Culprit (e.g., Missing Dimensions)]
                    │
                    ▼
[Apply Fix Globally Across the Single Parent Template]
                    │
                    ▼
[Verify Layout via Mobile and Trigger Search Console Validation]
Fixing an asset layout bug on your main article template automatically pushes that performance fix to every blog post on your site simultaneously. This template-first framework transforms an impossible technical mountain into a manageable evening task.
What it costs: time, money, and attention
Achieving clean performance metrics requires balancing time, direct expenses, and layout flexibility. If you run your platform on a modern content management setup, you can often reach acceptable performance ranges using completely free operational adjustments.
- Time Investment: Plan to spend roughly 4 to 6 hours during your initial audit cycle to identify large image bottlenecks, map out layout shifts, and test mobile responsiveness.
- Financial Cost: You do not need expensive premium cloud networks or enterprise optimization scripts. Standard site platforms combined with a free tier content delivery network (like Cloudflare) can easily pass the standard thresholds.
- Attention and Layout Compromises: The true cost of optimization is layout discipline. You must commit to avoiding heavy video backgrounds above the fold, multi-layered popups that block user interaction, and unoptimized font files that cause text shifting.
When to use this approach and when not to
Prioritize your page performance work when your site is already generating baseline organic impressions but struggling to hold positions on page one of the search results. When competitive positions shift constantly between ranks 3 and 7, achieving an immaculate Core Web Vitals score provides the exact algorithmic push needed to anchor your URL at the top.
Conversely, do not dedicate weeks of operational focus to performance metrics if your site has major structural content flaws, a broken indexing architecture, or zero inbound link authority. A site with a perfect 100/100 speed score will still generate zero search traffic if search engine crawlers are blocked from reading the text by an incorrect canonical tag setup.
The operational reality check
If you run a local service business site that generates less than 500 visits per month, spending thousands of dollars on custom development architecture to lower your response time by 150 milliseconds delivers a terrible return on investment. Focus your limited operational hours on writing clearer service pages, securing local reviews, and building citation relevance before worrying about minor layout performance metrics.
What to skip — and what to do instead
Skip the time-consuming process of manually converting thousands of old JPEG uploads into modern web formats individually. Do not waste days downloading, running desktop compression utilities, and re-uploading media assets to your media library.
Instead, implement a cloud-based asset optimization layer or an automated image compression plugin that handles conversion on the fly at your server level. Tools like cloud-based image optimization networks dynamically resize and convert assets to WebP format instantly based on the specific device screen requesting the file.
HTML
<img src="hero-graphic.jpg" alt="Company Hero Banner">

<img src="hero-graphic.webp" width="800" height="450" alt="Company Hero Banner" fetchpriority="high">
Look closely at the layout comparison above. The optimized markup provides explicit physical dimensions (width and height) directly to the user’s browser before the image finishes downloading. This allows the browser to reserve the exact layout space on the screen immediately, completely eliminating unexpected shifts in layout structure.
Frequently Asked Questions About Core Web Vitals
How often does Google update Core Web Vitals scores in Search Console?
Google uses a 28-day rolling window of real user data from the Chrome User Experience Report. When you fix a speed issue on a page, the metric changes gradually over four weeks rather than updating instantly.
Can a slow web host ruin my Core Web Vitals even if my site layout is optimized?
A cheap, unoptimized server introduces massive initial latency known as slow Time to First Byte. If your host takes more than 1.5 seconds to send the initial page file, your rendering targets become impossible to meet.
Do third-party tracking pixels affect my page experience stability metrics?
Every analytics tag, ad network script, and live chat widget added to your site injects foreign code that runs directly on your visitor’s device. These scripts block interaction responsiveness and frequently drop layout elements late.
Continue Exploring On-Page Optimization Systems
- optimize title tags: Learn how to engineer your search engine results page snippets to capture human clicks once your site performance metrics are stabilized.
- Category Hub: Return to our core architectural hub to explore the full spectrum of intent mapping, content structuring, and on-page authority design.